More about forecasting in cienciadedatos.net
- ARIMA and SARIMAX models with python
- Time series forecasting with machine learning
- Forecasting time series with gradient boosting: XGBoost, LightGBM and CatBoost
- Forecasting time series with XGBoost
- Global Forecasting Models: Multi-series forecasting
- Global Forecasting Models: Comparative Analysis of Single and Multi-Series Forecasting Modeling
- Probabilistic forecasting
- Forecasting with deep learning
- Forecasting energy demand with machine learning
- Forecasting web traffic with machine learning
- Intermittent demand forecasting
- Modelling time series trend with tree-based models
- Bitcoin price prediction with Python
- Stacking ensemble of machine learning models to improve forecasting
- Interpretable forecasting models
- Mitigating the Impact of Covid on forecasting Models
- Forecasting time series with missing values

Data drift
In the context of forecasting and machine learning, data drift refers to a change in the statistical properties of the input data over time compared to the data on which the model was originally trained. When this happens, the model may start to produce less accurate or unreliable predictions, since it no longer generalizes well to the new data distribution.
Data drift can take several forms:
Covariate Drift (Feature Drift): The distribution of the input features changes, but the relationship between features and target remains the same. Example: A model was trained when a feature had values in a certain range. Over time, if that feature shifts to a different range, covariate drift occurs.
Prior Probability Drift (Label Drift): The distribution of the target variable changes. Example: The average energy consumption increases because many new customers join the network, even though the way consumption responds to weather has not changed.
Concept Drift: The relationship between input features and the target variable changes. Example: A model predicting energy consumption from weather data might fail if new technologies or behaviors alter how weather affects energy usage.
Detecting and addressing data drift is crucial for maintaining model reliability in production environments. Common strategies include:
Monitoring input data during prediction to detect changes early.
Tracking model performance metrics (e.g., MAE, RMSE) over time.
Retraining models periodically with recent data to adapt to evolving conditions.
Skforecast includes two dedicated classes for data drift detection:
PopulationDriftDetector: detects changes at the population level, helping identify when a forecasting model should be retrained.RangeDriftDetector: detects changes at the single-observation level, suitable for validating input data during the prediction phase.
Population drift detection (model monitoring)
The ultimate goal of drift detection is to answer a simple but important question: Is the distribution of new data different from the distribution of the training data?
When there is no time component and the data points are independently and identically distributed (i.i.d.), this question is usually addressed with statistical tests. These tests measure some form of distance between the distributions of the two datasets and then calculate a probability value (p-value) to determine whether the difference is large enough to suggest a significant change.
However, this approach cannot be directly applied to time series data, where the distribution naturally changes over time due to patterns such as seasonality or trends. Detecting drift in this context requires methods that account for these expected temporal dynamics.
To better illustrate this concept, the following example compares two months (November and December 2011) of an hourly temperature series with the rest of the training series. These months follow the usual seasonal pattern of the series, so no drift should be detected.
# Libraries
# ==============================================================================
import pandas as pd
import numpy as np
import matplotlib.pyplot as plt
import seaborn as sns
from skforecast.datasets import fetch_dataset
from skforecast.plot import set_dark_theme
from skforecast.drift_detection import PopulationDriftDetector
from scipy.stats import ks_2samp
# Data
# ==============================================================================
data = fetch_dataset('bike_sharing', verbose=False)
data = data[['temp', 'hum']]
display(data.head())
data_train = data.iloc[: 9000].copy()
| temp | hum | |
|---|---|---|
| date_time | ||
| 2011-01-01 00:00:00 | 9.84 | 81.0 |
| 2011-01-01 01:00:00 | 9.02 | 80.0 |
| 2011-01-01 02:00:00 | 9.02 | 80.0 |
| 2011-01-01 03:00:00 | 9.84 | 75.0 |
| 2011-01-01 04:00:00 | 9.84 | 75.0 |
# Plot reference data and the two-month segment to test
# ==============================================================================
set_dark_theme()
fig, ax = plt.subplots(figsize=(8, 3))
test_data_starts = '2011-11-01 00:00:00'
test_data_ends = '2011-12-31 23:00:00'
test_data = data_train.loc[test_data_starts:test_data_ends, 'temp'].copy()
# The test segment is excluded from the reference so that both samples do not overlap
reference_data = data_train['temp'].drop(test_data.index)
# asfreq('h') reinserts the removed hours as NaN, leaving a gap in the plot
reference_data.asfreq('h').plot(ax=ax, label='Reference data')
test_data.plot(ax=ax, label='Test data')
ax.legend();

A Kolmogorov-Smirnov test is used to compare the distribution of the selected two-month segment with that of the reference series, formed by the rest of the training data. The segment is excluded from the reference because the test assumes that the two samples are independent, which would not be the case if one of them contained the other. The null hypothesis states that both samples come from the same distribution. If the p-value is below a certain threshold (commonly 0.05), we reject the null hypothesis, indicating that the distributions are significantly different, suggesting drift.
# Kolmogorov-Smirnov test to compare both data sets
# ==============================================================================
ks_2samp(reference_data, test_data)
KstestResult(statistic=np.float64(0.4681920225540357), pvalue=np.float64(6.569854259549597e-245), statistic_location=np.float64(21.32), statistic_sign=np.int8(-1))
# Plots to compare both data sets
# ==============================================================================
fig, axs = plt.subplots(ncols=2, figsize=(9, 3))
sns.kdeplot(reference_data, label='Reference data', color='#30a2da', ax=axs[0])
sns.kdeplot(test_data, label='Test data', color='red', ax=axs[0])
axs[0].set_title('Distribution Comparison')
axs[0].set_ylabel('Density')
axs[0].legend()
sns.ecdfplot(reference_data, label='Reference data', color='#30a2da', ax=axs[1])
sns.ecdfplot(test_data, label='Test data', color='red', ax=axs[1])
axs[1].set_title('Cumulative Distribution Comparison')
axs[1].set_ylabel('Cumulative Probability')
axs[1].legend();

The statistical test and the visualizations presented above show a clear difference between the distributions, although we know that no drift is present. There are two reasons for this false alarm:
Seasonality: November and December are among the coldest months of the year, so their temperatures are naturally lower than those of the rest of the year. A two-month segment is not expected to follow the annual distribution, even when the series behaves exactly as usual.
Temporal dependence: The Kolmogorov-Smirnov test assumes that observations are independent. Consecutive hourly temperatures are strongly autocorrelated, so the effective sample size is much smaller than the number of observations, and the p-value is far smaller than it should be.
This highlights the importance of using methods specifically designed for time series data when detecting drift. Instead of relying on the p-value of a test, the approach described below uses the test statistic as a distance and compares it with a threshold learned from the natural variability of the series itself.
Distance-based framework for temporal drift detection
This framework implements a distance-based, data-driven approach to detect temporal drift (changes in the underlying data distribution over time) within time series data. It constructs an empirical baseline of normal behavior from historical (reference) data and uses it to assess whether newly observed data deviates significantly from the established norm.
The approach is both model-agnostic and distance-agnostic: any statistical distance or divergence measure that quantifies dissimilarity between data samples can be employed (e.g., Kolmogorov-Smirnov, Chi-squared, Jensen-Shannon divergence, or other appropriate metrics).
1. Reference Phase: Estimating the Empirical Distribution
The first step is to characterize the natural variability of the time series under stable conditions.
Select a reference window
Choose a historical segment of the time series that represents stable and drift-free behavior. This segment serves as the reference dataset.Segment the reference data
Divide the reference time series into non-overlapping chunks of equal length: $$ \{ C_1, C_2, \ldots, C_n \} $$
Each chunk $C_i$ corresponds to a fixed temporal window (e.g., one week, one month, or a fixed number of samples).Compute chunk-to-reference distances
For each chunk $C_i$, compute its distance from the remainder of the reference dataset (or a representative aggregation thereof).
This produces a collection of distances: $$ \mathbb{D}_{ref} = \{ d_1, d_2, \ldots, d_n \} $$Build the empirical distribution
The set $\mathbb{D}_{ref}$ represents the distribution of distances under normal (non-drifting) conditions. It quantifies the typical level of dissimilarity between stable data segments.Define a drift threshold
Select a quantile (e.g., the 95th percentile) from the empirical distribution $\mathbb{D}_{ref}$ as the drift threshold: $$ \tau = Q_{0.95}(\mathbb{D}_{ref}) $$
Alternatively, the threshold can be defined as the mean plus a multiple $k$ of the standard deviation of the distances: $$ \tau = \mu(\mathbb{D}_{ref}) + k \, \sigma(\mathbb{D}_{ref}) $$
Any distance greater than $\tau$ indicates a deviation beyond what is expected under normal variability.
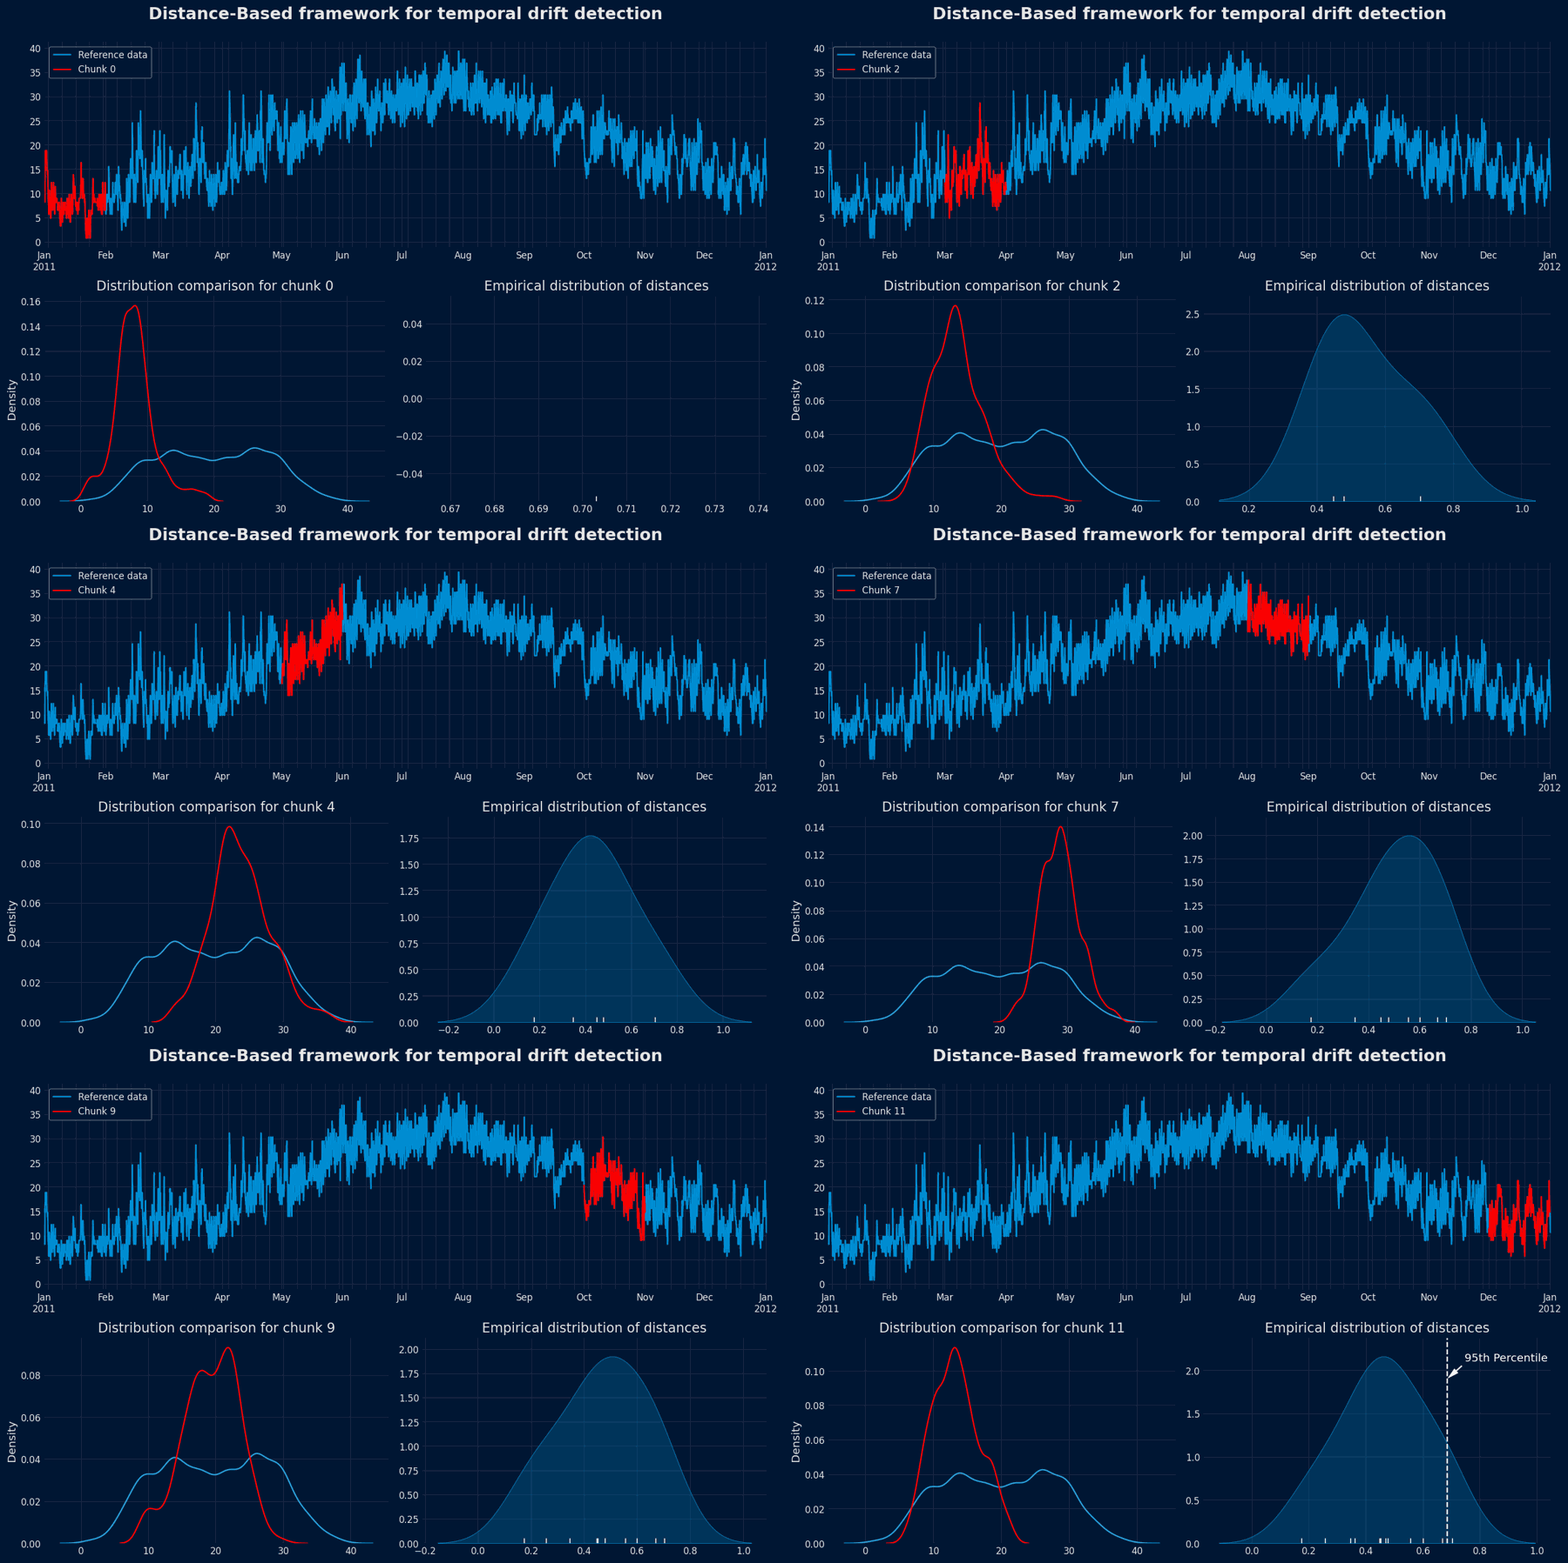
Population Drift Detection - Animation
2. Monitoring Phase: Detecting Drift in New Data
Once the baseline distribution is established, new data can be continuously evaluated for drift.
Chunk new data
As new observations become available, segment them into chunks of the same length used in the reference phase: $$ \{ C'_1, C'_2, \ldots, C'_m \} $$Compute distances to the reference
For each new chunk $C'_j$, compute its distance to the reference baseline (either to all reference chunks or to an aggregated representation of the reference distribution).Compare against the threshold
- If $d(C'_j, \text{reference}) \leq \tau$, the data is consistent with the reference distribution.
- If $d(C'_j, \text{reference}) > \tau$, flag the chunk as exhibiting potential drift.
Interpretation
A flagged chunk suggests that the new data segment differs significantly from historical norms, implying a possible covariate (feature) drift or label drift. Such cases may warrant further investigation, model retraining, or data pipeline adjustments.
⚠️ Warning
This framework compares the distribution of each variable separately, so it can detect covariate (feature) drift and label drift, but not concept drift. If the relationship between the predictors and the target changes while their distributions stay the same, the detector will not raise any alarm. To detect concept drift, monitor the forecasting error of the model over time (for example, the MAE of the most recent predictions compared with the error obtained during backtesting).
PopulationDriftDetector
The PopulationDriftDetector is designed to detect feature drift and label drift in time series data. It evaluates whether the distribution of the input variables (both target and exogenous) remains consistent with the data used to train the forecasting model.
By comparing recent observations with the training data, the detector identifies significant distributional changes that may indicate the model needs retraining.
The statistical metrics used depend on the data type:
Numerical features: Kolmogorov-Smirnov statistic and Jensen-Shannon distance.
Categorical features: Chi-squared statistic and Jensen-Shannon distance.
The API follows the same design principles as skforecast forecasters:
The same data used to train a forecaster can also be used to fit a
PopulationDriftDetector.When new historical data becomes available (i.e., multiple new observations), the
predictmethod can be used to check for drift.If drift is detected, users should analyze its cause and consider retraining or recalibrating the forecasting model.
✏️ Note
This implementation is inspired by NannyML's univariate drift detection, but provides a lightweight adaptation tailored to skforecast's time series context.
- Memory-efficient: The detector does not store the full reference data. Instead, it keeps only the precomputed statistics required to evaluate drift efficiently during prediction.
- Empirical thresholds: In addition to standard deviation-based thresholds, thresholds can be derived from the specified quantile of the empirical distributions computed from the reference data chunks using leave-one-chunk-out to avoid self-comparison bias.
- Out-of-range detection: It also checks for out-of-range values in numerical features and for unseen categories in categorical features.
- Multiple time series support: It can handle multiple time series, each one with its own exogenous variables.
If the user requires more advanced features, such as multivariate drift detection or data quality checks, consider using NannyML directly.
To illustrate how drift detection works, the dataset is divided into a training set (first 9000 hourly observations, from 2011-01-01 to 2012-01-10) and a new data partition (from 2012-01-11 to 2012-12-31), simulating a real-world scenario where additional data becomes available after the model has been trained.
To emulate data drift, the variable temp in the new data partition is intentionally modified:
June: Temperatures are increased by 10 °C.
July: Temperatures are increased by 20 °C.
October: Temperatures are replaced by a constant value equal to the mean of the original October 2012 temperatures. Although this value lies within the original range, its lack of variability makes it statistically atypical.
December: Temperatures are decreased by 10 °C.
The variable hum remains unchanged throughout the new data partition, serving as a control variable to demonstrate that the drift detector correctly identifies no drift when none exists.
# Split data: training set and new data
# ==============================================================================
# data_train (first 9000 observations) was created at the beginning of the document
data_new = data.iloc[9000:].copy()
print(
f'Train dates : {data_train.index.min()} --- {data_train.index.max()} '
f'(n={len(data_train)})'
)
print(
f'New dates : {data_new.index.min()} --- {data_new.index.max()} '
f'(n={len(data_new)})'
)
Train dates : 2011-01-01 00:00:00 --- 2012-01-10 23:00:00 (n=9000) New dates : 2012-01-11 00:00:00 --- 2012-12-31 23:00:00 (n=8544)
# Inject changes in the distribution
# ==============================================================================
data_new_drift = data_new.copy()
# June 2012: +10 degrees
data_new_drift.loc['2012-06', 'temp'] += 10
# July 2012: +20 degrees
data_new_drift.loc['2012-07', 'temp'] += 20
# October 2012: constant value equal to the mean of the original October values
data_new_drift.loc['2012-10', 'temp'] = data_new.loc['2012-10', 'temp'].mean()
# December 2012: -10 degrees
data_new_drift.loc['2012-12', 'temp'] -= 10
# Plot
# ==============================================================================
fig, ax = plt.subplots(figsize=(8, 4))
data_train.loc[:, 'temp'].plot(ax=ax, label='Train')
data_new_drift.loc[:, 'temp'].plot(ax=ax, label='New data with drift', color='red')
data_new.loc[:, 'temp'].plot(ax=ax, label='New data', color='green')
ax.axhline(data_train['temp'].max(), color='white', linestyle=':', label='Max Train')
ax.axhline(data_train['temp'].min(), color='white', linestyle=':', label='Min Train')
ax.legend();

When creating a PopulationDriftDetector instance, four arguments control its behavior (all of them have default values: chunk_size=None, threshold=3, threshold_method='std' and max_out_of_range_proportion=0.1):
chunk_size: Defines how the data is split into chunks used to compare distributions. It can be an integer (number of observations per chunk), a pandas frequency string that creates calendar-based chunks (for example,'W'for weeks or'MS'for calendar months; this requires a datetime index), orNoneto analyze all the data as a single chunk. A smaller chunk size enables more frequent drift checks but can increase false positives due to higher variability. Conversely, a larger chunk size smooths out variability but may delay drift detection. The optimal value depends on the trade-off between sensitivity and stability for the specific application and dataset.threshold: Specifies the threshold used to determine whether drift has occurred. The higher the threshold, the more conservative the detector will be in flagging drift. Its interpretation depends onthreshold_method: with'std'it is the number of standard deviations above the mean; with'quantile'it is the quantile level (e.g., 0.95) of the empirical distribution.threshold_method: Determines how the threshold is calculated from the empirical distribution. Options are:'std'for standard deviation-based thresholds. Thresholds are calculated as mean + threshold * std. This method is computationally faster since it does not require leave-one-chunk-out.'quantile'for quantile-based thresholds. Thresholds are derived from the specified quantile of the empirical distribution using leave-one-chunk-out to avoid self-comparison bias.
max_out_of_range_proportion: Maximum allowed proportion of observations outside the reference value range for numeric features. If the proportion of out-of-range values in a new data chunk exceeds this threshold, drift is flagged for the corresponding feature. This parameter provides an additional safeguard against distribution shifts that manifest as values falling outside the observed reference range.
# Fit detector using the training data
# ==============================================================================
pop_detector = PopulationDriftDetector(
chunk_size = 'MS', # Monthly chunks
threshold = 3,
threshold_method = 'std',
max_out_of_range_proportion = 0.1
)
pop_detector.fit(data_train)
pop_detector
PopulationDriftDetector
General Information
- Chunk size: MS
- Threshold: 3
- Threshold method: std
- Max out of range proportion: 0.1
- Is fitted: True
- Skforecast version: 0.27.0
Fitted features
-
['temp', 'hum']
Once the detector has been fitted, it can be used to evaluate new data using the predict method. This method returns two DataFrames:
Detailed results: Contains information about the computed statistics, thresholds, and drift status for each data chunk.
Summary results: Provides an overview showing the number and percentage of chunks where drift was detected.
# Detect drift in new data
# ==============================================================================
drift_results, drift_summary = pop_detector.predict(data_new_drift)
# Drift detailed results
# ==============================================================================
drift_results
| chunk | chunk_start | chunk_end | feature | ks_statistic | ks_threshold | chi2_statistic | chi2_threshold | js_statistic | js_threshold | reference_range | prop_out_of_range | max_out_of_range_proportion | is_out_of_range | drift_ks_statistic | drift_chi2_statistic | drift_js | drift_detected | |
|---|---|---|---|---|---|---|---|---|---|---|---|---|---|---|---|---|---|---|
| 0 | 0 | 2012-01-11 | 2012-01-31 23:00:00 | temp | 0.490175 | 0.904773 | NaN | NaN | 0.546958 | 0.806410 | (0.8200000000000001, 39.36) | 0.000000 | 0.1 | False | False | False | False | False |
| 1 | 1 | 2012-02-01 | 2012-02-29 23:00:00 | temp | 0.477663 | 0.904773 | NaN | NaN | 0.523748 | 0.806410 | (0.8200000000000001, 39.36) | 0.000000 | 0.1 | False | False | False | False | False |
| 2 | 2 | 2012-03-01 | 2012-03-31 23:00:00 | temp | 0.232412 | 0.904773 | NaN | NaN | 0.373938 | 0.806410 | (0.8200000000000001, 39.36) | 0.000000 | 0.1 | False | False | False | False | False |
| 3 | 3 | 2012-04-01 | 2012-04-30 23:00:00 | temp | 0.217000 | 0.904773 | NaN | NaN | 0.455947 | 0.806410 | (0.8200000000000001, 39.36) | 0.000000 | 0.1 | False | False | False | False | False |
| 4 | 4 | 2012-05-01 | 2012-05-31 23:00:00 | temp | 0.443082 | 0.904773 | NaN | NaN | 0.539446 | 0.806410 | (0.8200000000000001, 39.36) | 0.000000 | 0.1 | False | False | False | False | False |
| 5 | 5 | 2012-06-01 | 2012-06-30 23:00:00 | temp | 0.902111 | 0.904773 | NaN | NaN | 0.877304 | 0.806410 | (0.8200000000000001, 39.36) | 0.344444 | 0.1 | True | False | False | True | True |
| 6 | 6 | 2012-07-01 | 2012-07-31 23:00:00 | temp | 1.000000 | 0.904773 | NaN | NaN | 1.000000 | 0.806410 | (0.8200000000000001, 39.36) | 1.000000 | 0.1 | True | True | False | True | True |
| 7 | 7 | 2012-08-01 | 2012-08-31 23:00:00 | temp | 0.637269 | 0.904773 | NaN | NaN | 0.652528 | 0.806410 | (0.8200000000000001, 39.36) | 0.000000 | 0.1 | False | False | False | False | False |
| 8 | 8 | 2012-09-01 | 2012-09-30 23:00:00 | temp | 0.446389 | 0.904773 | NaN | NaN | 0.518331 | 0.806410 | (0.8200000000000001, 39.36) | 0.000000 | 0.1 | False | False | False | False | False |
| 9 | 9 | 2012-10-01 | 2012-10-31 23:00:00 | temp | 0.537556 | 0.904773 | NaN | NaN | 0.863793 | 0.806410 | (0.8200000000000001, 39.36) | 0.000000 | 0.1 | False | False | False | True | True |
| 10 | 10 | 2012-11-01 | 2012-11-30 23:00:00 | temp | 0.468611 | 0.904773 | NaN | NaN | 0.562611 | 0.806410 | (0.8200000000000001, 39.36) | 0.000000 | 0.1 | False | False | False | False | False |
| 11 | 11 | 2012-12-01 | 2012-12-31 23:00:00 | temp | 0.860731 | 0.904773 | NaN | NaN | 0.843966 | 0.806410 | (0.8200000000000001, 39.36) | 0.358871 | 0.1 | True | False | False | True | True |
| 12 | 0 | 2012-01-11 | 2012-01-31 23:00:00 | hum | 0.130825 | 0.385918 | NaN | NaN | 0.152290 | 0.423199 | (0.0, 100.0) | 0.000000 | 0.1 | False | False | False | False | False |
| 13 | 1 | 2012-02-01 | 2012-02-29 23:00:00 | hum | 0.161425 | 0.385918 | NaN | NaN | 0.199334 | 0.423199 | (0.0, 100.0) | 0.000000 | 0.1 | False | False | False | False | False |
| 14 | 2 | 2012-03-01 | 2012-03-31 23:00:00 | hum | 0.119387 | 0.385918 | NaN | NaN | 0.150733 | 0.423199 | (0.0, 100.0) | 0.000000 | 0.1 | False | False | False | False | False |
| 15 | 3 | 2012-04-01 | 2012-04-30 23:00:00 | hum | 0.278944 | 0.385918 | NaN | NaN | 0.328472 | 0.423199 | (0.0, 100.0) | 0.000000 | 0.1 | False | False | False | False | False |
| 16 | 4 | 2012-05-01 | 2012-05-31 23:00:00 | hum | 0.093703 | 0.385918 | NaN | NaN | 0.205141 | 0.423199 | (0.0, 100.0) | 0.000000 | 0.1 | False | False | False | False | False |
| 17 | 5 | 2012-06-01 | 2012-06-30 23:00:00 | hum | 0.171722 | 0.385918 | NaN | NaN | 0.240059 | 0.423199 | (0.0, 100.0) | 0.000000 | 0.1 | False | False | False | False | False |
| 18 | 6 | 2012-07-01 | 2012-07-31 23:00:00 | hum | 0.103219 | 0.385918 | NaN | NaN | 0.178075 | 0.423199 | (0.0, 100.0) | 0.000000 | 0.1 | False | False | False | False | False |
| 19 | 7 | 2012-08-01 | 2012-08-31 23:00:00 | hum | 0.110520 | 0.385918 | NaN | NaN | 0.196713 | 0.423199 | (0.0, 100.0) | 0.000000 | 0.1 | False | False | False | False | False |
| 20 | 8 | 2012-09-01 | 2012-09-30 23:00:00 | hum | 0.076111 | 0.385918 | NaN | NaN | 0.196889 | 0.423199 | (0.0, 100.0) | 0.000000 | 0.1 | False | False | False | False | False |
| 21 | 9 | 2012-10-01 | 2012-10-31 23:00:00 | hum | 0.125477 | 0.385918 | NaN | NaN | 0.217908 | 0.423199 | (0.0, 100.0) | 0.000000 | 0.1 | False | False | False | False | False |
| 22 | 10 | 2012-11-01 | 2012-11-30 23:00:00 | hum | 0.217556 | 0.385918 | NaN | NaN | 0.280111 | 0.423199 | (0.0, 100.0) | 0.000000 | 0.1 | False | False | False | False | False |
| 23 | 11 | 2012-12-01 | 2012-12-31 23:00:00 | hum | 0.096502 | 0.385918 | NaN | NaN | 0.187856 | 0.423199 | (0.0, 100.0) | 0.000000 | 0.1 | False | False | False | False | False |
# Drift summary
# ==============================================================================
drift_summary
| feature | n_chunks_with_drift | pct_chunks_with_drift | chunks_with_drift | |
|---|---|---|---|---|
| 0 | hum | 0 | 0.000000 | [] |
| 1 | temp | 4 | 33.333333 | [5, 6, 9, 11] |
As expected, the detector identifies drift in the modified new data, while no drift is detected in the unmodified months. Chunks 5, 6, 9 and 11 correspond to June, July, October and December 2012, the four months in which the temp values were modified. The control variable hum shows no drift, as expected. Note that chunk 0 only covers from 2012-01-11 to 2012-01-31: the new data starts in the middle of January and the chunks are aligned with calendar months.
The columns of drift_results show which criterion triggered each detection (a chunk is flagged if at least one of them exceeds its threshold):
July (+20 °C) is the only chunk flagged by all three criteria: Kolmogorov-Smirnov, Jensen-Shannon and out-of-range values.
June (+10 °C) and December (-10 °C) are flagged by the Jensen-Shannon distance and by the proportion of out-of-range values (about 34% and 36%, well above the allowed 10%), while their Kolmogorov-Smirnov statistics (0.902 and 0.861) stay below the threshold (0.905).
October (constant value) is flagged only by the Jensen-Shannon distance. The constant value lies within the training range, so the out-of-range check cannot detect it, but the collapse of the distribution into a single value is captured by the distance between histograms.
The thresholds themselves are also informative. For temp, the Kolmogorov-Smirnov and Jensen-Shannon thresholds are 0.905 and 0.806, much higher than for hum (0.386 and 0.423). Because of seasonality, each monthly chunk of temperature is naturally very different from the distribution of the whole year, and the detector learns this variability from the training data. This is what avoids the false alarm obtained with the Kolmogorov-Smirnov test at the beginning of the document: a statistic of that size (0.468) would be well below the threshold of 0.905. A large distance is not a sign of drift by itself, only a distance larger than those observed under normal conditions.
This illustrates why combining several complementary criteria, together with thresholds learned from the data, makes the detector more robust than relying on a single statistic.
# Highlight chunks with detected drift
# ==============================================================================
fig, ax = plt.subplots(figsize=(8, 4))
data_train.loc[:, 'temp'].plot(ax=ax, label='Train')
data_new_drift.loc[:, 'temp'].plot(ax=ax, label='New data with drift', color='red')
data_new.loc[:, 'temp'].plot(ax=ax, label='New data', color='green')
ax.axhline(data_train['temp'].max(), color='white', linestyle=':', label='Max Train')
ax.axhline(data_train['temp'].min(), color='white', linestyle=':', label='Min Train')
for row in drift_results.query('drift_detected == True').itertuples():
ax.axvspan(
row.chunk_start, row.chunk_end, color='red', alpha=0.3,
label='Drift detected'
)
# Remove repetitive labels in legend
handles, labels = ax.get_legend_handles_labels()
by_label = dict(zip(labels, handles))
ax.legend(by_label.values(), by_label.keys());

Control run with unmodified data
To verify that the detector does not raise false alarms, the same fitted detector is applied to the original new data, without any injected change. Since this data follows the usual behavior of the series, no drift should be detected.
# Control: detect drift in the unmodified new data
# ==============================================================================
drift_results_control, drift_summary_control = pop_detector.predict(data_new)
display(drift_summary_control)
cols = ['chunk', 'feature', 'ks_statistic', 'js_statistic', 'prop_out_of_range']
drift_results_control.loc[drift_results_control['feature'] == 'temp', cols]
| feature | n_chunks_with_drift | pct_chunks_with_drift | chunks_with_drift | |
|---|---|---|---|---|
| 0 | hum | 0 | 0.0 | [] |
| 1 | temp | 0 | 0.0 | [] |
| chunk | feature | ks_statistic | js_statistic | prop_out_of_range | |
|---|---|---|---|---|---|
| 0 | 0 | temp | 0.490175 | 0.546958 | 0.000000 |
| 1 | 1 | temp | 0.477663 | 0.523748 | 0.000000 |
| 2 | 2 | temp | 0.232412 | 0.373938 | 0.000000 |
| 3 | 3 | temp | 0.217000 | 0.455947 | 0.000000 |
| 4 | 4 | temp | 0.443082 | 0.539446 | 0.000000 |
| 5 | 5 | temp | 0.504222 | 0.551198 | 0.001389 |
| 6 | 6 | temp | 0.669190 | 0.682659 | 0.001344 |
| 7 | 7 | temp | 0.637269 | 0.652528 | 0.000000 |
| 8 | 8 | temp | 0.446389 | 0.518331 | 0.000000 |
| 9 | 9 | temp | 0.264778 | 0.476207 | 0.000000 |
| 10 | 10 | temp | 0.468611 | 0.562611 | 0.000000 |
| 11 | 11 | temp | 0.464176 | 0.536117 | 0.000000 |
No chunk is flagged for either variable. The largest statistics of temp in the unmodified data (Kolmogorov-Smirnov 0.669 and Jensen-Shannon 0.683, both in July) remain clearly below the thresholds (0.905 and 0.806), and only about 0.1% of the observations of June and July exceed the training range, far from the allowed 10%. Running a control like this one is a good practice to check that the chosen chunk_size and threshold are not too sensitive for the data at hand.
Std-based vs quantile-based thresholds
The detector above uses threshold_method='std'. The alternative, threshold_method='quantile', defines each threshold as a quantile of the empirical distribution of distances, computed with leave-one-chunk-out. The following code fits a second detector using the 0.95 quantile and compares the thresholds and the empirical distances of both methods.
# Compare std-based and quantile-based thresholds
# ==============================================================================
pop_detector_quantile = PopulationDriftDetector(
chunk_size = 'MS',
threshold = 0.95,
threshold_method = 'quantile',
max_out_of_range_proportion = 0.1
)
pop_detector_quantile.fit(data_train)
print(f'Number of reference chunks: {pop_detector_quantile.n_chunks_reference_data_}')
print('Sorted KS distances of temp in the reference chunks:')
for method, detector in [('std', pop_detector), ('quantile', pop_detector_quantile)]:
ks_distances = np.sort(detector.empirical_dist_ks_['temp'])
print(f' {method:<8}: ' + ', '.join(f'{x:.3f}' for x in ks_distances))
thresholds = pd.concat(
[
pop_detector.get_thresholds().assign(method='std'),
pop_detector_quantile.get_thresholds().assign(method='quantile'),
]
)
thresholds[['method', 'feature', 'ks_threshold', 'js_threshold']]
Number of reference chunks: 13 Sorted KS distances of temp in the reference chunks: std : 0.168, 0.249, 0.350, 0.359, 0.436, 0.458, 0.463, 0.467, 0.469, 0.566, 0.609, 0.676, 0.693 quantile: 0.182, 0.271, 0.381, 0.391, 0.475, 0.481, 0.499, 0.503, 0.504, 0.615, 0.664, 0.737, 0.756
| method | feature | ks_threshold | js_threshold | |
|---|---|---|---|---|
| 0 | std | temp | 0.904773 | 0.806410 |
| 1 | std | hum | 0.385918 | 0.423199 |
| 0 | quantile | temp | 0.744513 | 0.749058 |
| 1 | quantile | hum | 0.327353 | 0.361759 |
# Detect drift with quantile-based thresholds
# ==============================================================================
drift_results_quantile, drift_summary_quantile = pop_detector_quantile.predict(
data_new_drift
)
drift_summary_quantile
| feature | n_chunks_with_drift | pct_chunks_with_drift | chunks_with_drift | |
|---|---|---|---|---|
| 0 | hum | 0 | 0.000000 | [] |
| 1 | temp | 4 | 33.333333 | [5, 6, 9, 11] |
Both methods flag the same four chunks (June, July, October and December), but the thresholds differ:
Std-based: The threshold for the Kolmogorov-Smirnov statistic of
temp(0.905) is the mean of the reference distances plus three standard deviations. It lies well above the largest distance observed in the reference data (0.693), which makes the detector conservative.Quantile-based: The threshold (0.745) is the 0.95 quantile of only 13 distances, so it is obtained by interpolating between the two largest ones (0.737 and 0.756). Note that these distances are larger than those of the std-based detector because, with leave-one-chunk-out, each chunk is compared with a reference that does not contain it. The lower thresholds make this detector more sensitive: the Kolmogorov-Smirnov statistics of June (0.902) and December (0.861) now exceed the threshold. These statistics are the same for both detectors, because each new chunk is always compared with the full reference data; only the thresholds change. On the other hand, the margin with respect to the unmodified data is smaller (the largest distance in the control run was 0.669).
With few reference chunks, the quantile-based threshold depends almost entirely on the one or two most extreme chunks, so a single unusual month in the reference period could change it substantially. As a rule of thumb, 'quantile' is preferable when the reference data contains many chunks (for example, several years of data with weekly chunks), while 'std' is a more stable choice when only a few chunks are available, as in this example.
Multiple time series
PopulationDriftDetector can be used with multiple time series simultaneously, each one with its own features. In this case, the input data must be a pandas DataFrame with a MultiIndex, where the first level is the series identifier (series_id), and the second level corresponds to the temporal index (date_time).
In the following example, three series with the same features are created. series_2 receives the new data with the drift injected in the previous section, while series_1 and series_3 receive the unmodified new data. Once the detector is fitted, the get_thresholds method returns the thresholds computed for each series and feature.
# Multi-series data: drift is injected only in series_2
# ==============================================================================
series_ids = ['series_1', 'series_2', 'series_3']
data_multiseries_train = pd.concat(
{series_id: data_train for series_id in series_ids},
names=['series_id', 'date_time']
)
data_multiseries_new = pd.concat(
{'series_1': data_new, 'series_2': data_new_drift, 'series_3': data_new},
names=['series_id', 'date_time']
)
display(data_multiseries_train)
| temp | hum | ||
|---|---|---|---|
| series_id | date_time | ||
| series_1 | 2011-01-01 00:00:00 | 9.84 | 81.0 |
| 2011-01-01 01:00:00 | 9.02 | 80.0 | |
| 2011-01-01 02:00:00 | 9.02 | 80.0 | |
| 2011-01-01 03:00:00 | 9.84 | 75.0 | |
| 2011-01-01 04:00:00 | 9.84 | 75.0 | |
| ... | ... | ... | ... |
| series_3 | 2012-01-10 19:00:00 | 15.58 | 46.0 |
| 2012-01-10 20:00:00 | 13.94 | 53.0 | |
| 2012-01-10 21:00:00 | 13.12 | 66.0 | |
| 2012-01-10 22:00:00 | 12.30 | 70.0 | |
| 2012-01-10 23:00:00 | 10.66 | 81.0 |
27000 rows × 2 columns
# Multi-series PopulationDriftDetector
# ==============================================================================
pop_detector_multiseries = PopulationDriftDetector(
chunk_size = 'MS', # Monthly chunks
threshold = 3,
threshold_method = 'std',
max_out_of_range_proportion = 0.1
)
pop_detector_multiseries.fit(data_multiseries_train)
pop_detector_multiseries
PopulationDriftDetector
General Information
- Chunk size: MS
- Threshold: 3
- Threshold method: std
- Max out of range proportion: 0.1
- Is fitted: True
- Skforecast version: 0.27.0
Fitted features
-
{'series_1': ['temp', 'hum'], 'series_2': ['temp', 'hum'], 'series_3': ['temp', 'hum']}
# Thresholds per series
# ==============================================================================
pop_detector_multiseries.get_thresholds()
| series_id | feature | ks_threshold | chi2_threshold | js_threshold | max_out_of_range_proportion | |
|---|---|---|---|---|---|---|
| 0 | series_1 | temp | 0.904773 | NaN | 0.806410 | 0.1 |
| 1 | series_1 | hum | 0.385918 | NaN | 0.423199 | 0.1 |
| 2 | series_2 | temp | 0.904773 | NaN | 0.806410 | 0.1 |
| 3 | series_2 | hum | 0.385918 | NaN | 0.423199 | 0.1 |
| 4 | series_3 | temp | 0.904773 | NaN | 0.806410 | 0.1 |
| 5 | series_3 | hum | 0.385918 | NaN | 0.423199 | 0.1 |
# Detect drift in new multi-series data
# ==============================================================================
drift_results_multiseries, drift_summary_multiseries = (
pop_detector_multiseries.predict(data_multiseries_new)
)
drift_summary_multiseries
| series_id | feature | n_chunks_with_drift | pct_chunks_with_drift | chunks_with_drift | |
|---|---|---|---|---|---|
| 0 | series_1 | hum | 0 | 0.000000 | [] |
| 1 | series_1 | temp | 0 | 0.000000 | [] |
| 2 | series_2 | hum | 0 | 0.000000 | [] |
| 3 | series_2 | temp | 4 | 33.333333 | [5, 6, 9, 11] |
| 4 | series_3 | hum | 0 | 0.000000 | [] |
| 5 | series_3 | temp | 0 | 0.000000 | [] |
Drift is detected only in the feature temp of series_2, in chunks 5, 6, 9 and 11 (June, July, October and December 2012), the same chunks found in the single-series example. series_1 and series_3, which received the unmodified new data, show no drift, and neither does hum in any series. Since the three series share the same training data, their thresholds are identical; in a real application, each series would have its own thresholds learned from its own history.
Drift detection during prediction
Skforecast provides the class RangeDriftDetector to detect covariate drift in both single and multiple time series, as well as in exogenous variables.
The detector checks whether the input data (lags and exogenous variables) used to predict new values fall within the range of the data used to train the model.
Its API follows the same design as the forecasters:
The data used to train a forecaster can also be used to fit the
RangeDriftDetector.The data passed to the forecaster's
predictmethod can also be passed to thepredictmethod ofRangeDriftDetectorto check for drift in the input data before making predictions.If drift is detected, users should analyze its cause and consider whether the model is still appropriate for making predictions with the new data.
# Libraries
# ==============================================================================
from sklearn.ensemble import HistGradientBoostingRegressor
from skforecast.recursive import ForecasterRecursive
from skforecast.drift_detection import RangeDriftDetector
Detecting out-of-range values in a single series
The RangeDriftDetector checks whether the values of a time series remain consistent with the data seen during training.
For numeric variables, it verifies that each new value falls within the minimum and maximum range of the training data. Values outside this range are flagged as potential drift.
For categorical variables, it checks whether each new category was observed during training. Unseen categories are flagged as potential drift.
This mechanism allows you to quickly identify when the model is receiving inputs that differ from those it was trained on, helping you decide whether to retrain the model or adjust preprocessing.
# Simulated data
# ==============================================================================
rng = np.random.default_rng(123)
y_train = pd.Series(
rng.normal(loc=10, scale=2, size=100),
index=pd.date_range(start='2020-01-01', periods=100),
name='y',
)
exog_train = pd.DataFrame(
{
'exog_1': rng.normal(loc=10, scale=2, size=100),
'exog_2': rng.choice(['A', 'B', 'C', 'D', 'E'], size=100),
},
index=y_train.index,
)
display(y_train.head())
display(exog_train.head())
2020-01-01 8.021757 2020-01-02 9.264427 2020-01-03 12.575851 2020-01-04 10.387949 2020-01-05 11.840462 Freq: D, Name: y, dtype: float64
| exog_1 | exog_2 | |
|---|---|---|
| 2020-01-01 | 8.968465 | B |
| 2020-01-02 | 13.316227 | B |
| 2020-01-03 | 9.405475 | A |
| 2020-01-04 | 7.233246 | A |
| 2020-01-05 | 9.437591 | A |
# Train RangeDriftDetector
# ==============================================================================
range_detector = RangeDriftDetector()
range_detector.fit(series=y_train, exog=exog_train)
range_detector
RangeDriftDetector
General Information
- Fitted series: y
- Fitted exogenous: exog_1, exog_2
- Series-specific exogenous: False
- Is fitted: True
- Skforecast version: 0.27.0
Series value ranges
-
{'y': (5.5850578036003915, 14.579819894629157)}
Exogenous value ranges
-
{'exog_1': (4.5430286262543085, 14.531041199734418), 'exog_2': {'E', 'A', 'C', 'B', 'D'}}
Let's assume the model is deployed in production and new data is being used to forecast future values. We simulate a covariate drift in the target series and in the exogenous variables to illustrate how to use the RangeDriftDetector class to detect it.
# Prediction with drifted data
# ==============================================================================
last_window = pd.Series(
[6.6, 7.5, 100, 9.3, 10.2], name='y' # Value 100 is out of range
)
exog_predict = pd.DataFrame(
{
'exog_1': [8, 9, 10, 70, 12], # Value 70 is out of range
'exog_2': ['A', 'B', 'C', 'D', 'W'], # Category 'W' not seen during training
}
)
flag_out_of_range, series_out_of_range, exog_out_of_range = range_detector.predict(
last_window = last_window,
exog = exog_predict,
verbose = True,
suppress_warnings = False
)
print('Out of range detected :', flag_out_of_range)
print('Series out of range :', series_out_of_range)
print('Exogenous out of range :', exog_out_of_range)
╭────────────────────────────── FeatureOutOfRangeWarning ──────────────────────────────╮ │ 'y' has values outside the range seen during training [5.58506, 14.57982]. This may │ │ affect the accuracy of the predictions. │ │ │ │ Category : skforecast.exceptions.FeatureOutOfRangeWarning │ │ Location : │ │ C:\Users\Joaquin\miniconda3\envs\skforecast_27_py13\Lib\site-packages\skforecast\dri │ │ ft_detection\_range_drift.py:284 │ │ Suppress : warnings.simplefilter('ignore', category=FeatureOutOfRangeWarning) │ ╰──────────────────────────────────────────────────────────────────────────────────────╯
╭────────────────────────────── FeatureOutOfRangeWarning ──────────────────────────────╮ │ 'exog_1' has values outside the range seen during training [4.54303, 14.53104]. This │ │ may affect the accuracy of the predictions. │ │ │ │ Category : skforecast.exceptions.FeatureOutOfRangeWarning │ │ Location : │ │ C:\Users\Joaquin\miniconda3\envs\skforecast_27_py13\Lib\site-packages\skforecast\dri │ │ ft_detection\_range_drift.py:284 │ │ Suppress : warnings.simplefilter('ignore', category=FeatureOutOfRangeWarning) │ ╰──────────────────────────────────────────────────────────────────────────────────────╯
╭────────────────────────────── FeatureOutOfRangeWarning ──────────────────────────────╮ │ 'exog_2' has values not seen during training. Seen values: {'E', 'A', 'C', 'B', │ │ 'D'}. This may affect the accuracy of the predictions. │ │ │ │ Category : skforecast.exceptions.FeatureOutOfRangeWarning │ │ Location : │ │ C:\Users\Joaquin\miniconda3\envs\skforecast_27_py13\Lib\site-packages\skforecast\dri │ │ ft_detection\_range_drift.py:284 │ │ Suppress : warnings.simplefilter('ignore', category=FeatureOutOfRangeWarning) │ ╰──────────────────────────────────────────────────────────────────────────────────────╯
╭───────────────────────────── Out-of-range summary ──────────────────────────────╮ │ Series: │ │ 'y' has values outside the observed range [5.58506, 14.57982]. │ │ │ │ Exogenous Variables: │ │ 'exog_1' has values outside the observed range [4.54303, 14.53104]. │ │ 'exog_2' has values not seen during training. Seen values: {'E', 'A', 'C', 'B', │ │ 'D'}. │ ╰─────────────────────────────────────────────────────────────────────────────────╯
Out of range detected : True Series out of range : ['y'] Exogenous out of range : ['exog_1', 'exog_2']
The predict method returns three values:
flag_out_of_range:Trueif any variable has values outside the training range or unseen categories.series_out_of_range: list of series with out-of-range values.exog_out_of_range: list of exogenous variables with out-of-range values or unseen categories.
All three simulated anomalies are detected: the value 100 in y is above its training maximum (14.58), the value 70 in exog_1 is above its training maximum (14.53), and the category 'W' of exog_2 was never observed during training. With verbose=True, a summary is displayed, and with suppress_warnings=False, a FeatureOutOfRangeWarning is raised for each affected variable.
Detecting out-of-range values in multiple series
The same process applies when modeling multiple time series.
For each series, the
RangeDriftDetectorchecks whether the new values remain within the range of the training data.If exogenous variables are included, they are checked grouped by series, ensuring that drift is detected in the correct context.
This allows you to monitor drift at the per-series level, making it easier to spot issues in specific series without being misled by aggregated results.
# Simulated data - Multiple time series
# ==============================================================================
idx = pd.MultiIndex.from_product(
[
['series_1', 'series_2', 'series_3'],
pd.date_range(start='2020-01-01', periods=3),
],
names=['series_id', 'datetime'],
)
series_train = pd.DataFrame(
{'values': [1, 2, 3, 10, 20, 30, 100, 200, 300]}, index=idx
)
exog_train = pd.DataFrame(
{
'exog_1': [5.0, 6.0, 7.0, 15.0, 25.0, 35.0, 150.0, 250.0, 350.0],
'exog_2': ['A', 'B', 'C', 'D', 'E', 'F', 'G', 'H', 'I'],
},
index=idx,
)
display(series_train)
display(exog_train)
| values | ||
|---|---|---|
| series_id | datetime | |
| series_1 | 2020-01-01 | 1 |
| 2020-01-02 | 2 | |
| 2020-01-03 | 3 | |
| series_2 | 2020-01-01 | 10 |
| 2020-01-02 | 20 | |
| 2020-01-03 | 30 | |
| series_3 | 2020-01-01 | 100 |
| 2020-01-02 | 200 | |
| 2020-01-03 | 300 |
| exog_1 | exog_2 | ||
|---|---|---|---|
| series_id | datetime | ||
| series_1 | 2020-01-01 | 5.0 | A |
| 2020-01-02 | 6.0 | B | |
| 2020-01-03 | 7.0 | C | |
| series_2 | 2020-01-01 | 15.0 | D |
| 2020-01-02 | 25.0 | E | |
| 2020-01-03 | 35.0 | F | |
| series_3 | 2020-01-01 | 150.0 | G |
| 2020-01-02 | 250.0 | H | |
| 2020-01-03 | 350.0 | I |
# Train RangeDriftDetector - Multiple time series
# ==============================================================================
range_detector_multiseries = RangeDriftDetector()
range_detector_multiseries.fit(series=series_train, exog=exog_train)
Note that last_window is passed in wide format (a DataFrame with one column per series), while the exogenous variables are passed in long format (a DataFrame with a MultiIndex formed by the series identifier and the date).
# New data with drift - Multiple time series
# ==============================================================================
last_window = pd.DataFrame(
{
'series_1': [1.5, 2.3],
'series_2': [100, 20], # Value 100 is out of range [10, 30]
'series_3': [110, 200],
},
index=pd.date_range(start='2020-01-02', periods=2),
)
# series_2: exog_1 values 10 and 70 are out of range [15, 35]
# series_3: exog_2 categories 'W' and 'E' were not seen for series_3
idx = pd.MultiIndex.from_product(
[
['series_1', 'series_2', 'series_3'],
pd.date_range(start='2020-01-04', periods=2),
],
names=['series_id', 'datetime'],
)
exog_predict = pd.DataFrame(
{
'exog_1': [5.0, 6.1, 10, 70, 220, 290],
'exog_2': ['A', 'B', 'D', 'F', 'W', 'E'],
},
index=idx,
)
display(last_window)
display(exog_predict)
| series_1 | series_2 | series_3 | |
|---|---|---|---|
| 2020-01-02 | 1.5 | 100 | 110 |
| 2020-01-03 | 2.3 | 20 | 200 |
| exog_1 | exog_2 | ||
|---|---|---|---|
| series_id | datetime | ||
| series_1 | 2020-01-04 | 5.0 | A |
| 2020-01-05 | 6.1 | B | |
| series_2 | 2020-01-04 | 10.0 | D |
| 2020-01-05 | 70.0 | F | |
| series_3 | 2020-01-04 | 220.0 | W |
| 2020-01-05 | 290.0 | E |
# Prediction with drifted data - Multiple time series
# ==============================================================================
flag_out_of_range, series_out_of_range, exog_out_of_range = (
range_detector_multiseries.predict(
last_window = last_window,
exog = exog_predict,
verbose = True,
suppress_warnings = False
)
)
print('Out of range detected :', flag_out_of_range)
print('Series out of range :', series_out_of_range)
print('Exogenous out of range :', exog_out_of_range)
╭────────────────────────────── FeatureOutOfRangeWarning ──────────────────────────────╮ │ 'series_2' has values outside the range seen during training [10.00000, 30.00000]. │ │ This may affect the accuracy of the predictions. │ │ │ │ Category : skforecast.exceptions.FeatureOutOfRangeWarning │ │ Location : │ │ C:\Users\Joaquin\miniconda3\envs\skforecast_27_py13\Lib\site-packages\skforecast\dri │ │ ft_detection\_range_drift.py:284 │ │ Suppress : warnings.simplefilter('ignore', category=FeatureOutOfRangeWarning) │ ╰──────────────────────────────────────────────────────────────────────────────────────╯
╭────────────────────────────── FeatureOutOfRangeWarning ──────────────────────────────╮ │ 'series_2': 'exog_1' has values outside the range seen during training [15.00000, │ │ 35.00000]. This may affect the accuracy of the predictions. │ │ │ │ Category : skforecast.exceptions.FeatureOutOfRangeWarning │ │ Location : │ │ C:\Users\Joaquin\miniconda3\envs\skforecast_27_py13\Lib\site-packages\skforecast\dri │ │ ft_detection\_range_drift.py:284 │ │ Suppress : warnings.simplefilter('ignore', category=FeatureOutOfRangeWarning) │ ╰──────────────────────────────────────────────────────────────────────────────────────╯
╭────────────────────────────── FeatureOutOfRangeWarning ──────────────────────────────╮ │ 'series_3': 'exog_2' has values not seen during training. Seen values: {'G', 'H', │ │ 'I'}. This may affect the accuracy of the predictions. │ │ │ │ Category : skforecast.exceptions.FeatureOutOfRangeWarning │ │ Location : │ │ C:\Users\Joaquin\miniconda3\envs\skforecast_27_py13\Lib\site-packages\skforecast\dri │ │ ft_detection\_range_drift.py:284 │ │ Suppress : warnings.simplefilter('ignore', category=FeatureOutOfRangeWarning) │ ╰──────────────────────────────────────────────────────────────────────────────────────╯
╭────────────────────────────── Out-of-range summary ──────────────────────────────╮ │ Series: │ │ 'series_2' has values outside the observed range [10.00000, 30.00000]. │ │ │ │ Exogenous Variables: │ │ 'series_2': 'exog_1' has values outside the observed range [15.00000, 35.00000]. │ │ 'series_3': 'exog_2' has values not seen during training. Seen values: {'G', │ │ 'H', 'I'}. │ ╰──────────────────────────────────────────────────────────────────────────────────╯
Out of range detected : True
Series out of range : ['series_2']
Exogenous out of range : {'series_2': ['exog_1'], 'series_3': ['exog_2']}
The detector reports the following:
Series:
series_2has the value 100 in its last window, above its training range [10, 30]. The values ofseries_3(110 and 200) are within its own range [100, 300], so they are not flagged.exog_1ofseries_2: The values 10 and 70 are both outside the range observed for this series during training [15, 35].exog_2ofseries_3: The categories'W'and'E'were not observed for this series during training (only'G','H'and'I'were). Note that'E'was observed inseries_2, but since exogenous variables are checked per series, it is still unseen forseries_3.
Because exogenous variables are checked per series, exog_out_of_range is returned as a dictionary whose keys are the series and whose values are the affected exogenous variables.
Combining RangeDriftDetector with Forecasters
When deploying a forecaster in production, it is good practice to pair it with a drift detector. Both are trained on the same dataset, so the drift detector can verify the input data before the forecaster makes predictions. In the following example, a ForecasterRecursive and a RangeDriftDetector are trained with the same data.
# Data
# ==============================================================================
data_h2o = fetch_dataset(name='h2o_exog', verbose=False)
data_h2o.index.name = 'datetime'
data_h2o.head(3)
| y | exog_1 | exog_2 | |
|---|---|---|---|
| datetime | |||
| 1992-04-01 | 0.379808 | 0.958792 | 1.166029 |
| 1992-05-01 | 0.361801 | 0.951993 | 1.117859 |
| 1992-06-01 | 0.410534 | 0.952955 | 1.067942 |
# Train Forecaster and RangeDriftDetector
# ==============================================================================
steps = 36
exog_features = ['exog_1', 'exog_2']
data_h2o_train = data_h2o.iloc[:-steps, :]
data_h2o_test = data_h2o.iloc[-steps:, :]
forecaster = ForecasterRecursive(
estimator = HistGradientBoostingRegressor(random_state=123),
lags = 15
)
range_detector_h2o = RangeDriftDetector()
forecaster.fit(
y = data_h2o_train['y'],
exog = data_h2o_train[exog_features]
)
range_detector_h2o.fit(
series = data_h2o_train['y'],
exog = data_h2o_train[exog_features]
)
If you use the last_window stored in the Forecaster, checking it for drift is unnecessary because it corresponds to the final window of the training data. The exogenous variables of the forecast horizon, however, are always new data, so they should be checked in any case. In production environments, however, you may supply an external last_window from a different time period. In that case, checking it for drift is recommended.
In the example below, the external last_window is identical to the final training window, so no drift is expected in it, and the exogenous variables of the test period are checked as well.
# Last window (same as forecaster.last_window_)
# ==============================================================================
last_window = data_h2o_train['y'].iloc[-forecaster.max_lag:]
last_window
datetime 2004-04-01 0.739986 2004-05-01 0.795129 2004-06-01 0.856803 2004-07-01 1.001593 2004-08-01 0.994864 2004-09-01 1.134432 2004-10-01 1.181011 2004-11-01 1.216037 2004-12-01 1.257238 2005-01-01 1.170690 2005-02-01 0.597639 2005-03-01 0.652590 2005-04-01 0.670505 2005-05-01 0.695248 2005-06-01 0.842263 Freq: MS, Name: y, dtype: float64
# Check data with RangeDriftDetector and predict with Forecaster
# ==============================================================================
range_detector_h2o.predict(
last_window = last_window,
exog = data_h2o_test[exog_features],
verbose = True,
suppress_warnings = False
)
predictions = forecaster.predict(
steps = steps,
last_window = last_window,
exog = data_h2o_test[exog_features]
)
predictions.head()
╭───────────────── Out-of-range summary ─────────────────╮ │ Series: │ │ No series with out-of-range values found. │ │ │ │ Exogenous Variables: │ │ No exogenous variables with out-of-range values found. │ ╰────────────────────────────────────────────────────────╯
2005-07-01 0.986181 2005-08-01 1.030542 2005-09-01 1.098085 2005-10-01 1.140578 2005-11-01 1.129119 Freq: MS, Name: pred, dtype: float64
The detector finds no out-of-range values in either the last window or the exogenous variables, so there is no evidence of covariate drift in the inputs and the forecaster is not asked to extrapolate beyond the range seen during training. Keep in mind that this check does not guarantee accurate predictions: values within the training range can still follow a different relationship with the target (concept drift).
Why out-of-range inputs matter for tree-based models
Out-of-range values are particularly harmful for models based on decision trees, such as HistGradientBoostingRegressor, LightGBM or XGBoost. Each split of a tree compares a predictor with a threshold learned from the training data, so any value above the largest split threshold is treated exactly like the largest training values. As a consequence, these models cannot extrapolate: in practice, their predictions stay within the range of the target seen during training.
To illustrate this, suppose that the level of the series has increased by 50%. The external last_window is multiplied by 1.5, so most of its values exceed the training maximum, and both the detector and the forecaster receive it.
# Simulate an external last window with values above the training range
# ==============================================================================
last_window_drift = last_window * 1.5
range_detector_h2o.predict(
last_window = last_window_drift,
exog = data_h2o_test[exog_features],
verbose = True,
suppress_warnings = False
)
predictions_drift = forecaster.predict(
steps = steps,
last_window = last_window_drift,
exog = data_h2o_test[exog_features]
)
n_lags_above = (last_window_drift > data_h2o_train['y'].max()).sum()
print(f'Lags above the training maximum : {n_lags_above} of {len(last_window_drift)}')
print(f'Max prediction with drifted window: {predictions_drift.max():.3f}')
predictions_comparison = pd.DataFrame(
{'original_window': predictions, 'drifted_window': predictions_drift}
)
predictions_comparison.loc['2005-12':'2006-03'].round(3)
╭────────────────────────────── FeatureOutOfRangeWarning ──────────────────────────────╮ │ 'y' has values outside the range seen during training [0.36180, 1.25724]. This may │ │ affect the accuracy of the predictions. │ │ │ │ Category : skforecast.exceptions.FeatureOutOfRangeWarning │ │ Location : │ │ C:\Users\Joaquin\miniconda3\envs\skforecast_27_py13\Lib\site-packages\skforecast\dri │ │ ft_detection\_range_drift.py:284 │ │ Suppress : warnings.simplefilter('ignore', category=FeatureOutOfRangeWarning) │ ╰──────────────────────────────────────────────────────────────────────────────────────╯
╭──────────────────── Out-of-range summary ─────────────────────╮ │ Series: │ │ 'y' has values outside the observed range [0.36180, 1.25724]. │ │ │ │ Exogenous Variables: │ │ No exogenous variables with out-of-range values found. │ ╰───────────────────────────────────────────────────────────────╯
Lags above the training maximum : 9 of 15 Max prediction with drifted window: 1.103
| original_window | drifted_window | |
|---|---|---|
| 2005-12-01 | 1.138 | 1.081 |
| 2006-01-01 | 1.119 | 1.093 |
| 2006-02-01 | 0.675 | 1.020 |
| 2006-03-01 | 0.654 | 1.100 |
# Plot predictions with the original and the drifted last window
# ==============================================================================
fig, ax = plt.subplots(figsize=(8, 4))
data_h2o_train.loc['2002':, 'y'].plot(ax=ax, label='Train')
last_window_drift.plot(ax=ax, label='Last window x 1.5', color='red')
predictions.plot(
ax=ax, label='Predictions (original last window)', color='limegreen'
)
predictions_drift.plot(
ax=ax, label='Predictions (last window x 1.5)', color='red', linestyle='--'
)
ax.axhline(
data_h2o_train['y'].max(), color='white', linestyle=':', label='Max Train'
)
ax.legend();

The detector raises a FeatureOutOfRangeWarning because the last window contains values above the training range [0.362, 1.257]. The effect on the predictions is clear:
Although the last observed values reach almost 1.9, the predictions obtained with the drifted window never exceed 1.103, which is even below the training maximum. The lags above the training range (9 of the 15) are treated as if they were equal to the largest training values, so the model has no way to produce higher values.
The seasonal pattern is also lost. With the original window, the prediction drops from 1.12 in January 2006 to 0.68 in February 2006; with the drifted window, it only goes from 1.09 to 1.02. Trees learn rules based on absolute values, not on relative patterns: after scaling, the lagged values no longer resemble those that preceded a seasonal drop in the training data, so the model does not anticipate it.
If the level of the series had really increased by 50%, these predictions would be severely biased, and nothing in the output of the forecaster itself would reveal it. Checking the input data with a RangeDriftDetector before predicting is a simple way to detect this situation.
Key takeaways
Classical two-sample tests, such as Kolmogorov-Smirnov, are not suitable for detecting drift in time series: seasonality and autocorrelation produce false alarms even when the series behaves as usual.
Drift should be assessed by comparing the distance between new data and the reference with the distances observed among chunks of the reference data itself, not with a fixed p-value.
Monitoring the distribution of the input data detects covariate (feature) drift and label drift, but not concept drift. The forecasting error of the model must also be tracked.
Models based on decision trees cannot extrapolate: when they receive inputs outside the training range, their predictions stay, in practice, within the range of values seen during training.
The following table summarizes the two detectors available in skforecast:
| - | PopulationDriftDetector |
RangeDriftDetector |
|---|---|---|
| Level | Population (chunks of observations) | Individual observations |
| When to use it | Periodically, once enough new data has accumulated (model monitoring) | Before each prediction |
Input to predict |
New data (target and exogenous variables) | last_window and exog passed to the forecaster |
| Criteria | Kolmogorov-Smirnov, Chi-squared, Jensen-Shannon and proportion of out-of-range values | Values outside the training range and unseen categories |
| Output | Detailed results per chunk and feature, and a summary | Global flag, and the series and exogenous variables out of range |
When drift is detected, a reasonable sequence of actions is:
Check the data pipeline. Many apparent drifts are caused by data errors: changes of units, sensor failures, missing values filled with a constant (like the October example), or new categories created by a change in coding.
Assess the impact on the model. Compare the error of the most recent predictions with the error obtained during backtesting. A drift that does not degrade performance may not require any action.
Retrain or adapt the model. If the change is real and persistent, retrain the model including the most recent data, or give more weight to recent observations (see weighted time series forecasting).
Session information
import session_info
session_info.show(html=False)
----- matplotlib 3.11.2 numpy 2.5.4 pandas 2.3.3 scipy 1.18.1 seaborn 0.13.2 session_info v1.0.1 skforecast 0.27.0 sklearn 1.9.1 ----- IPython 9.17.1 jupyter_client 8.10.0 jupyter_core 5.9.1 ----- Python 3.13.18 | packaged by conda-forge | (main, Oct 26 2026, 11:30:40) [MSC v.1944 64 bit (AMD64)] Windows-11-10.0.26200-SP0 ----- Session information updated at 2026-11-11 22:53
Citation
How to cite this document
If you use this document or any part of it, please acknowledge the source, thank you!
Data drift detection in time series forecasting models by Joaquín Amat Rodrigo and Javier Escobar Ortiz, available under an Attribution-NonCommercial-ShareAlike 4.0 International at https://www.cienciadedatos.net/documentos/py70-drift-detection-forecasting-model.html
How to cite skforecast
If you use skforecast for a publication, we would appreciate it if you cite the published software.
Zenodo:
Amat Rodrigo, Joaquin, & Escobar Ortiz, Javier. (2026). skforecast (v0.27.0). Zenodo. https://doi.org/10.5281/zenodo.8382787
APA:
Amat Rodrigo, J., & Escobar Ortiz, J. (2026). skforecast (Version 0.27.0) [Computer software]. https://doi.org/10.5281/zenodo.8382787
BibTeX:
@software{skforecast, author = {Amat Rodrigo, Joaquin and Escobar Ortiz, Javier}, title = {skforecast}, version = {0.27.0}, month = {11}, year = {2026}, license = {BSD-3-Clause}, url = {https://skforecast.org/}, doi = {10.5281/zenodo.8382787} }
Did you like the article? Your support is important
Your contribution will help me to continue generating free educational content. Many thanks! 😊




This work by Joaquín Amat Rodrigo and Javier Escobar Ortiz is licensed under a Attribution-NonCommercial-ShareAlike 4.0 International.
Allowed:
-
Share: copy and redistribute the material in any medium or format.
-
Adapt: remix, transform, and build upon the material.
Under the following terms:
-
Attribution: You must give appropriate credit, provide a link to the license, and indicate if changes were made. You may do so in any reasonable manner, but not in any way that suggests the licensor endorses you or your use.
-
NonCommercial: You may not use the material for commercial purposes.
-
ShareAlike: If you remix, transform, or build upon the material, you must distribute your contributions under the same license as the original.